Is Buying a House a Good Investment?

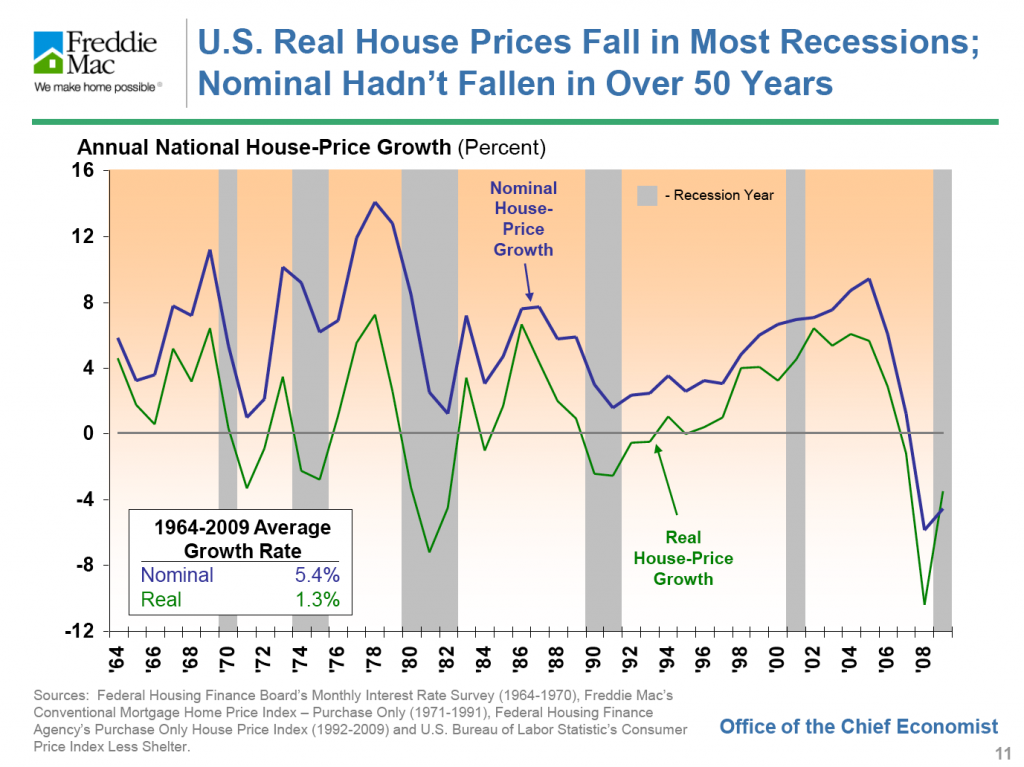
Among the scions of the real estate industry presenting at the Fisher Conference (see my previous post) was none other than Frank Nothaft, Chief Economist and Vice President of Freddie Mac.  He had a doozy of a slide set.  Here’s one my favorites.  More to follow.


The chart shows that nominal (ie. not inflation-adjusted) prices hadn’t shown an actual decline in over 50 years prior to 2006/7.  Real (inflation-adjusted) prices have fallen in previous recessions, though with the exception of 1980-82, those declines were pretty small.  This time round, though, we’re down big-time.

An inflation-adjusted annual average price growth of 1.3% sure doesn’t sound like much to me.  And that number’s not going up a lot even if you discount the suislide of the last three years.  Proof that a home isn’t a “good investment?”  I’ve never suggested that it is.

Doesn’t look a whole lot better even after you factor in leverage.  If you’ve put 20% down, the rate of return on your equity increases five-fold.  Now we’re up to a whole 6.5% gross return.  But that’s before all the expenses of ownership not to mention the endless lists of things “to do.”

Of course, the real reason to buy a home is because it’s about “shelter” in the broadest sense of the word.  It’s as basic as finding a comfortable cave for yourself and your loved ones and painting beautiful drawings on the walls.

Did you like this? Share it:
Posted in Economy, single family homes | Tagged , , , | 2 Comments

Ken Rosen Says “Buy Now”

University of California, Berkeley

Image via Wikipedia

Just back from the Fisher Center for Real Estate and Urban Economic’s semi-annual symposium on all things real estate.  (FCREUE is the real estate department within UC Berkeley’s Haas Business School.)

Ken Rosen is the Center’s oft-quoted co-chair and quietly advises real estate investment funds with over $300 million in assets.  Most of the time these symposiums take a very high-level view of real estate:  it’s an asset class to be compared to other assets, and the focus is usually on institutional investors and broad real estate segments.

But with the housing melt-down, recent symposiums have been very much about the lowly residential market, both national and local, albeit within the wider context of the economy as a whole.

Rosen almost always delivers a fact and slide-packed economic forecast. It’s a big part of why I go.  Here are some of his current observations and predictions:

  • The Shape of the Recovery:
    • Chances of a fragile recovery:  55%.  We’ve already had a big bounce; he expects a slowdown for the rest of the year (This is  a broken “W”)
    • Chances of a moderate recovery:  35% (This is the “U”)
    • Chances of a mild recession:  10%, (Think an “L” with a sinking bottom.)
  • Jobs: He thinks the job situation will turn around by the end of 2010 (other speakers weren’t so sure.)  San Francisco has already started adding jobs.
  • Interest Rates:  Rosen thinks that the Fed is already missing the boat on inflation and that it’s inevitable.  Just as important, he thinks that the Fed should already be raising short-term interests, though he thinks it’ll keep them at near zero for another six months or so.

“Two years from now, short term interest rates will be back up to 4%.”

As for 30 year fixed mortgages, if rates go up to 6%, the real estate market will probably still be ok.  If they go to 7%, we’re in trouble.

  • Home Prices. US Single family home sales will look good for the next few months but then will slow towards the end of the year.  Lots of people are coming back on to the market because they see movement and because of the tax credits.

And now the takeaway:

“If you feel secure [in your job], now is a good time to buy because interest rates are going to go higher and prices probably won’t go much lower.”

Oh, and one last thing:  Short China real estate. They’re in a massive bubble of their own.

Reblog this post [with Zemanta]
Did you like this? Share it:
Posted in Economy, interest rates | Tagged , , , , | 1 Comment

Alphabet Soup Revisited: What Shape Will the Recovery Take?

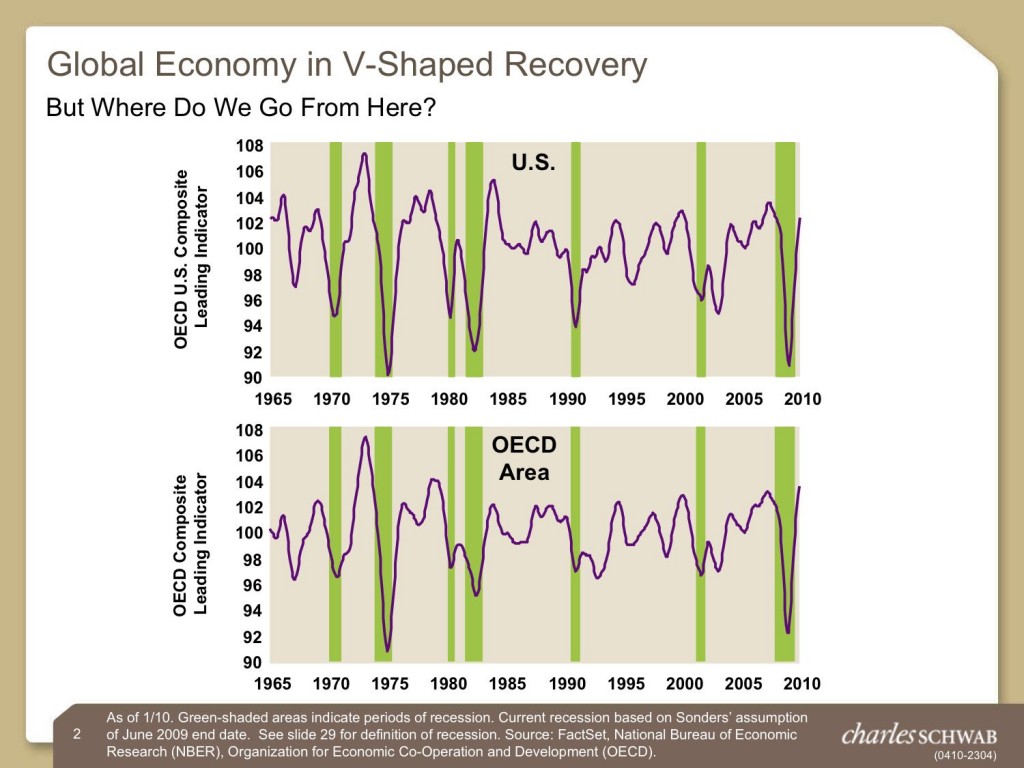
Back in the still-uncertain days of September 09, every market pundit had his or her own letter for what shape the recovery would take. I blogged about Ben Bernanke‘s “U,” Liz Ann Sonders‘ “V,” and Nouriel Roubini‘s “W” here. Though one could argue the jury is still out, I think it’s fair to say that Liz Ann won round one.  The recovery is looking and feeling like a “V”  — and in fact is falling pretty much within historical patterns. (Full disclosure — I had my money on Nouriel.)

I recently spent 20 minutes listening to her most recent webcast, and it all sounds pretty seensible.  What I like about Sonders in particular is that she’s basically a contrarian. So many people are betting against the stock market’s phenomenal rise right now — and in favor of bonds — that she thinks that the bears are refusing to accept the fact that a solid recovery is in place.  I like the way she puts it in a related article:

Skeptics are often the loudest folks in the room, and the bear case is often the more “intellectual” case, but the market has a tendency to reward the minority view, not the majority view.

What’s all this got to do with San Francisco residential real estate?  One of her points touches on a theme that I’ve sounded here recently. As everyone knows, interest rates are likely to rise as the economy starts to strengthen and the Fed starts turning off the easy credit spigot.   Sonders is not predicting the stratospheric rates that occurred in the early 1980’s.  Nevertheless, it doesn’t take much of an increase in rates to have a significant impact 0n the amount of house you can buy.

Say you’re thinking about borrowing $700,000 on a 30 year fixed rate loan at the current rate of 5.25%.  Your payment would be just under $3,900 a month.  Now say that interest rates increase by just half a percent to 5.75%.  Your monthly payment would increase to just under $4,100 a month.  Maybe a difference of $200 a month doesn’t sound like that much:  a couple of fancy restaurant dinners would would cost the same.

But look at it this way.  Say that the the maximum you’ve decided — or the bank’s decided — you can afford to pay each month on your mortgage is $3,900 a month.  Now that half percent increase in rates means that the maximum loan you can qualify for is around $662,000.  That’s a loss of $38,000 in the amount you can borrow and the amount of house you can buy.

It’s also a heck of a lot of fancy dinners.

Reblog this post [with Zemanta]
Did you like this? Share it:
Posted in Economy, interest rates, Loans | Tagged , , , , , , , , , , , , | Leave a comment

What’s Better than One New Home-Buyer Tax Credit? Two.

California Route Marker

Image via Wikipedia

As if one new home buyer tax credit weren’t enough, the State of California recently re-enacted and extended the scope of its own version, originally passed in 2009.   As a result, some California buyers can take advantage of both — but only if all the stars align, and only for a short period of time.

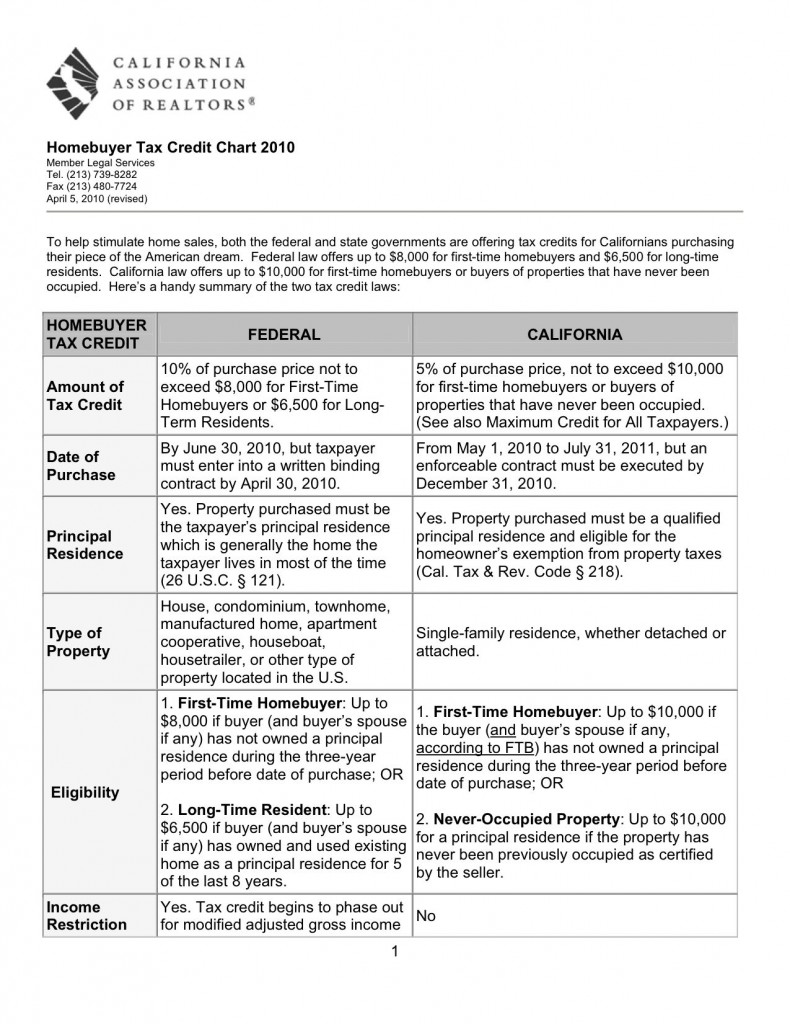
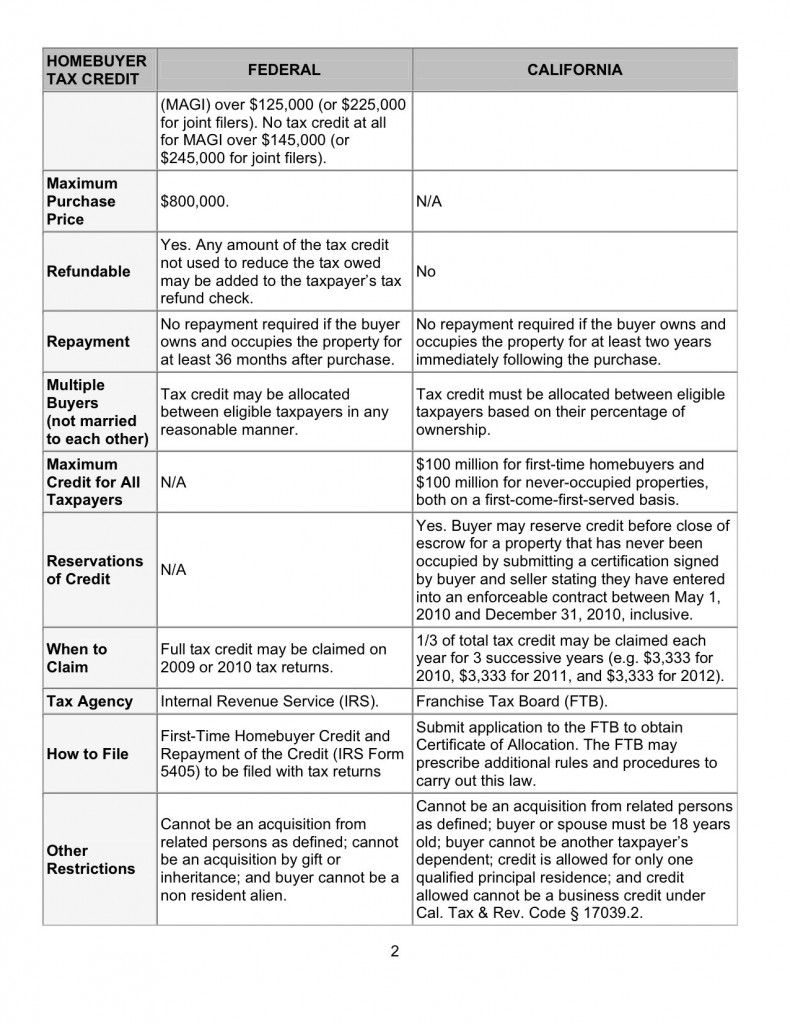
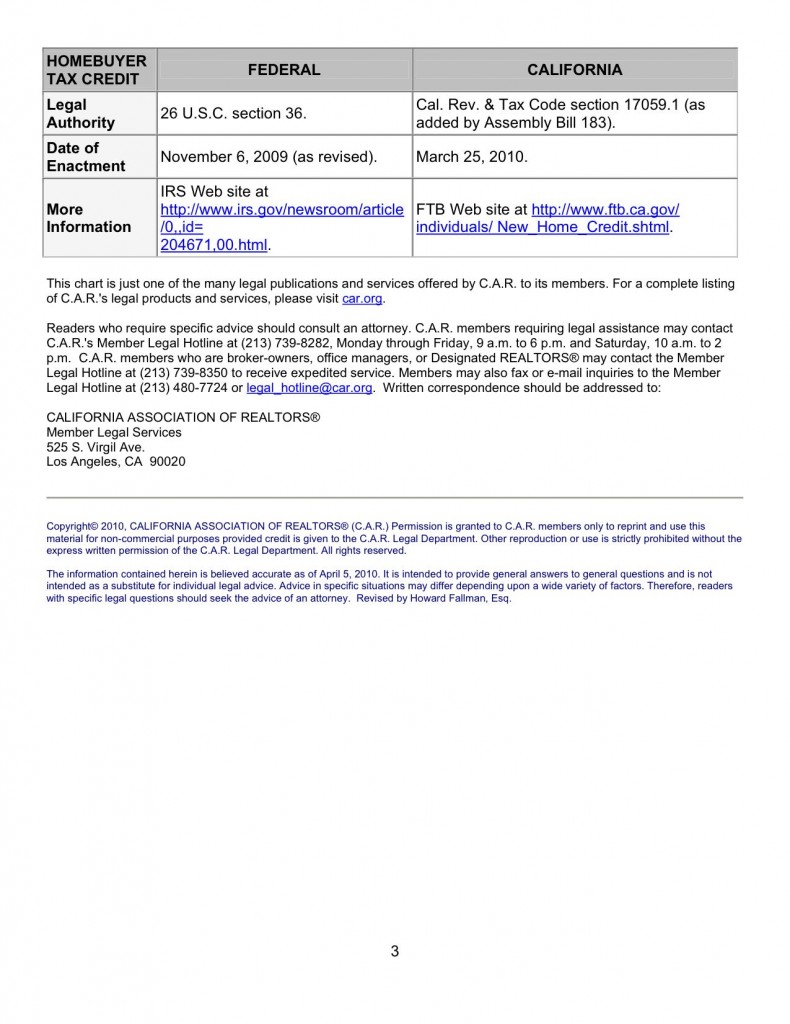
The California Association of Realtors has published a useful chart that compares the two tax credits and I’ve reproduced it below (click to enlarge).

The rules are complicated, (see here for the Franchise Tax Board explanation) but here are a few key takeaways:

  • To take advantage of both credits, you’ll need to be in escrow no later than April 20, 2010 and close escrow no later than June 30, 1010 — these time periods are driven by the federal tax credit.
  • Even if you’re eligible for the full $10,000 California tax credit, you only get to claim a third of it per year for the next three years.
  • Individual filers with adjusted gross income over $125,000 ($225,000 for joint filers) get a reduced deduction under the federal program.  There’s no federal credit at all for filers with adjusted gross income over $145,000 ($245,000 for joint filers).

If you figure SF median home prices at around $750,000, and assuming you could even qualify for a 75% loan and yet be under the maximum income limit, you’d be “saving” around 2.4% on your purchase if you qualified for every penny of both tax credits — less, since the California credit is spread over three years.  18 big ones isn’t small change in anybody’s language, but it surely shouldn’t be enough to drive anyone’s home-buying decision.

Reblog this post [with Zemanta]
Did you like this? Share it:
Posted in tax | Tagged , , | 1 Comment

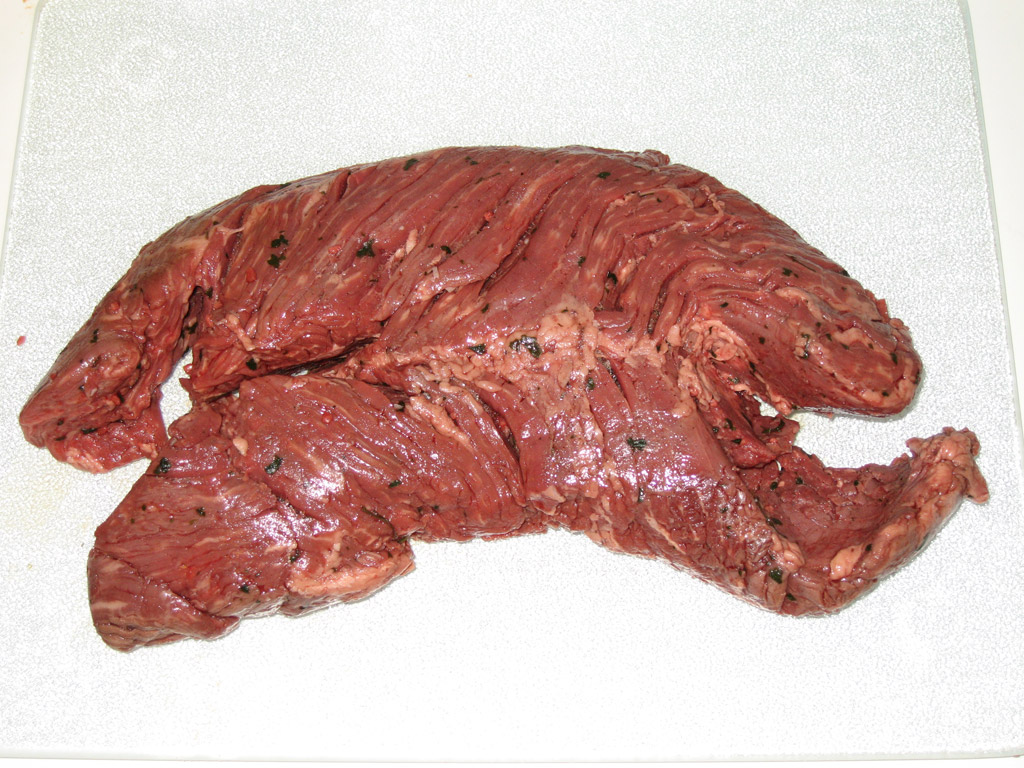
Hanger Steak

And now for something completely different. What’s even closer to my heart than real estate?  Food.

A hanger steak is a cut of beef steak which is said to “hang” from the diaphragm of the steer.[

That’s a meaty description. There’s only one per steer and since it “hangs” close to the kidneys, it’s said to be particularly flavorful.

But cook it for a minute too long and it gets as tough as the hide from which it was parted.

These days, it’s becoming easier to find.  I picked some up at Whole Foods in Noe Valley for around $8.99 a pound.

French bistros serve hanger steak — onglet —  with a shallot sauce, pommes frites, and a pichet of rot-gut red.  My version takes about 10 minutes from refrigerator to table.  The challenge is to really believe it’s cooked after just 90 seconds per side.

Hanger Steak with Shallots

Ingredients (serves 2)
6 oz of hanger steak, in one or two pieces
1 large shallot, finely chopped
balsamic vinegar
¼ tsp beef concentrate
1/3 cup of water
2 or 3 tbs butter, cut into 3 pieces
non-virgin olive oil, salt and freshly ground pepper
a few slices of French or Italian batard

Warm a couple of plates in the oven. Season the meat with salt and pepper. Add around a tablespoon of oil to a heavy non-stick pan and heat until almost smoking.  Add the meat and count to 90 – slowly.  Flip and do the same on the other side. Take out the warm plates, put on the slices of bread and place the meat on top of the bread.  Return to the oven. Lower the heat to medium, toss the shallots into the dry pan and stir constantly for about minute until the shallots are just soft and not burned.

Add a long splash of balsamic vinegar to the shallots and stir quickly. The sauce should get sticky almost immediately.  Add the water and beef concentrate and continue stirring for a minute or two while the sauce reduces.  Lower the heat and stir in the pats of butter one by one.  Pour over the meat and serve.

Did you like this? Share it:
Posted in Personal, Recipes | Tagged , | 2 Comments

Case-Shiller Sounds a Cautiously Positive Note

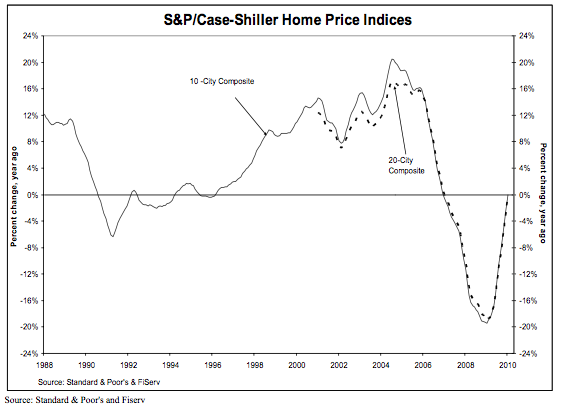
Last week, Case-Shiller released January data for its closely watched national housing index.  Nationally, things are looking up – well, make that flat.  And that’s good news. In the wonderfully backward language of the report, the index’s year over year rate of decline “improved.”  Basically, we are back to where housing values were a year ago.

Since for most of us our homes represent our biggest asset, that’s pretty good news when you consider how bleak things looked back in March of 2009.  Just think of how you were feeling about your 401(k)s.

But before you break out the champagne, consider that national home prices have now “recovered” to levels last seen in Autumn 2003.  That’s over six years of appreciation wiped out.

The San Francisco Metropolitan Statistical Area (that’s 5 of the 9 Bay Area Counties, folks) is up 15.2% from its trough value. Case-Shiller does not break out San Francisco proper from the much larger MSA.  However, I calculate that median prices in January were up just 10% from the lows reached in March 2009.  (I use 3 month moving averages, which approximates the seasonal adjustments the CS Index uses.)  To see how SF did through 2009, check out my blog and charts here.

Did you like this? Share it:
Posted in Data, Economy, Market news | Tagged , | 1 Comment

Noe Valley: The Condo/TIC market

At long last, here’s the promised data on Noe Valley condos and TIC’s.

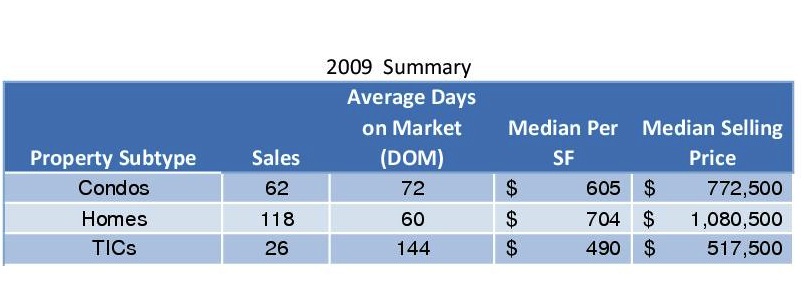
First, a look back (in anger?) at the make-up of Noe Valley sales in 2009.

Note that there were more than twice as many condos sold as TICs, and more homes sold than condos and TICs put together. (What’s a TIC?  — Check out my series of posts on Tenancy-In-Common Interests, starting here.)

Also, that absurdly long DOM for TICs was distorted by 3 TICs at 201 Hoffman that took 410 days to sell.  Still, without those sales, DOM for TICs (tired of the acronyms yet?) was still 99 days.  And I’d be somewhat skeptical of the whopping difference in price between TICs and condos as well:  TICs sales often don’t have a price per square foot listed, so there are very few data points — and there are very few sales to begin with.

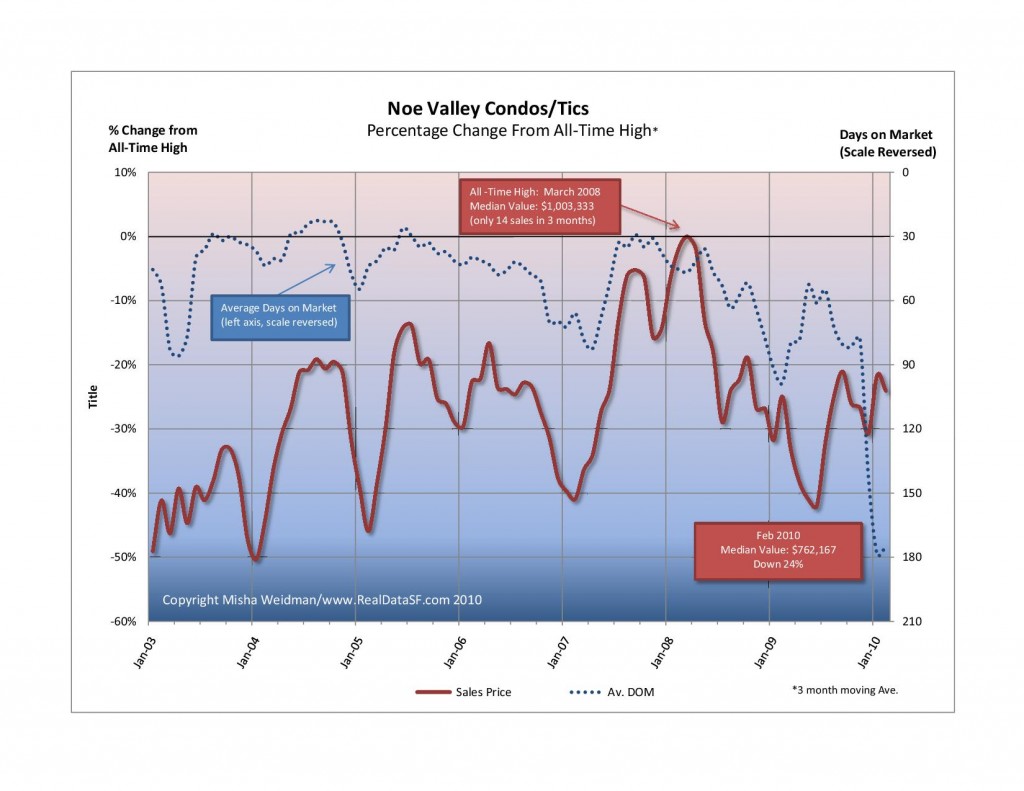
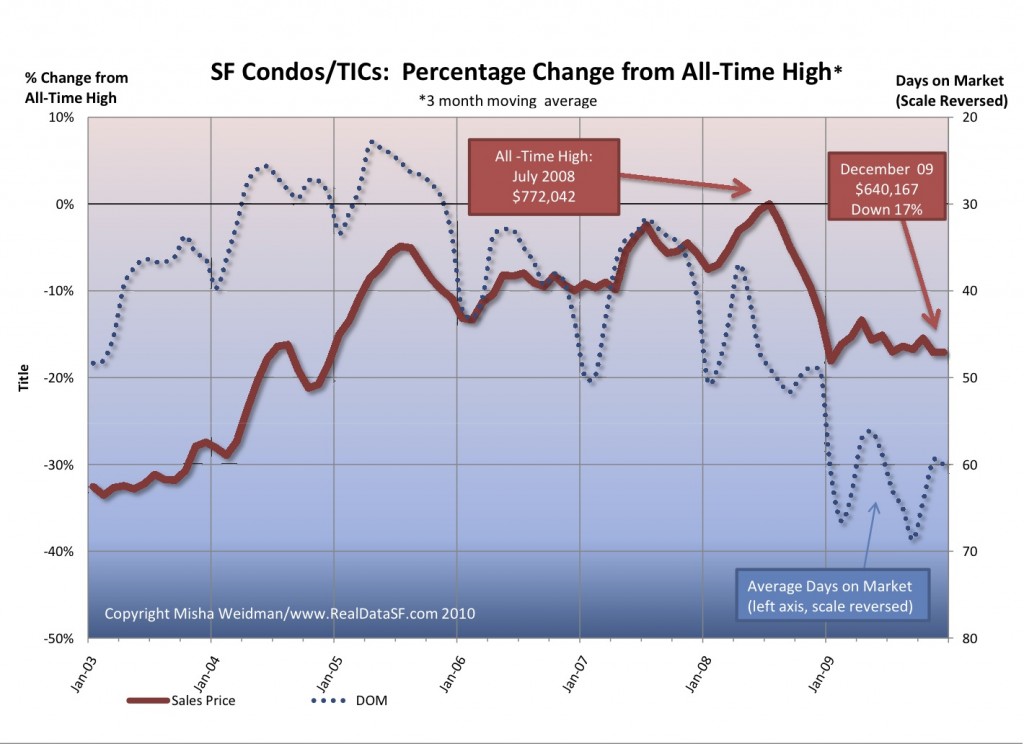
Here’s how condos and TICs have been doing as a combined group, versus their all-time highs.

That precipitous plunge (actually a huge increase since the scale is reversed) in DOM at the end of 2009 was also due to the lingering effects of 201 Hoffman.

For a shorter term view, prices through February 2010 are up 11% from January 2009 and are up a whopping 31% from the trough of June 2009.  Since I use trailing 3 month averages, I think this is a belated reflection of the deep credit freeze of Spring 2009 when we thought the world might come to an end.

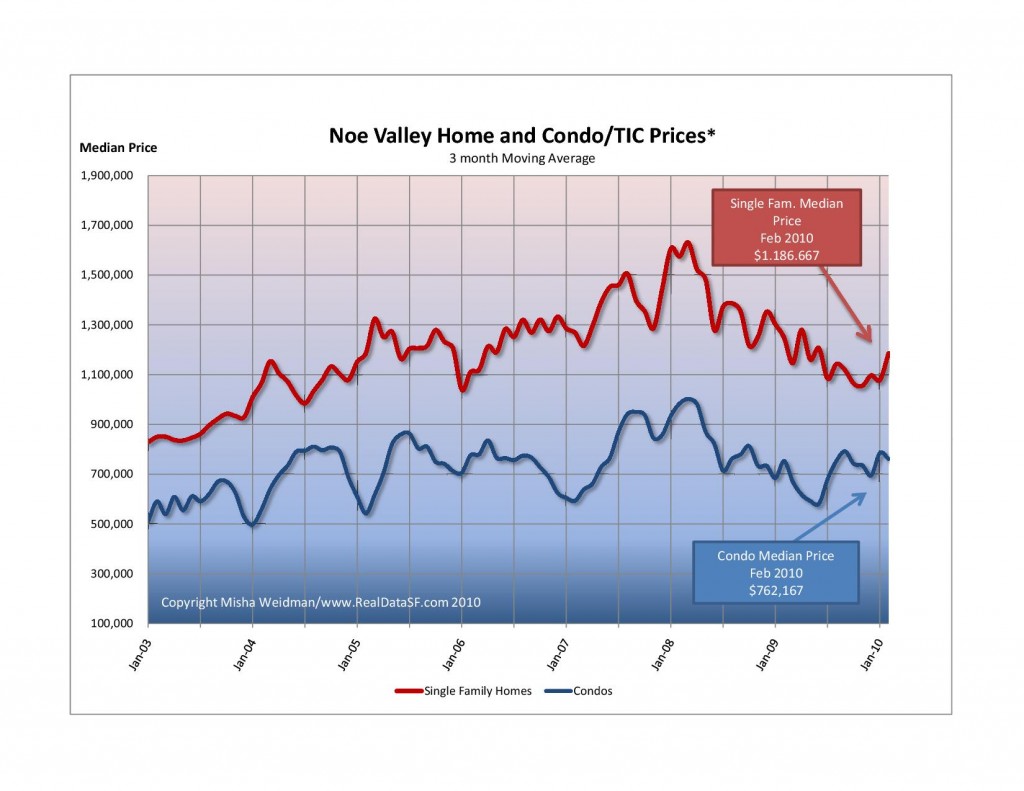
And here’s how condos and TICs stacked up against homes.

For what it’s worth, it feels like spring has really sprung.  Nice-looking condos/tics are swarming with people and are moving fast — no kidding.  Whether it will last is anybody’s guess.

Did you like this? Share it:
Posted in Condominiums, Data, Noe Valley, single family homes, Tenancy In Common | Tagged , , , , , | Leave a comment

Is Now a Good Time to Buy?

In an article entitled Great Time to Buy (Famous Last Words), last Sunday’s New York Times took a swipe at perennially optimistic real estate agents who have never seen a time that wasn’t a good time to buy a house.  Fair enough.  Self-interest and magical thinking are not limited to the real estate profession.

For the record, I’ve never suggested to anyone that buying a home is a good “investment.”  You can do much better in the stock market and probably even in bonds.

However, I am beginning to think that if you’re going to shackle yourself to a home, now may not be a bad time to buy.  And I think the NY Times article supports my position.

Why do I think so?  Most of the articles I’ve been reading suggest that the worst is over in terms of price declines, this article included.  That doesn’t mean that prices couldn’t drop another 5 to 10%.  But it’s a fool’s errand to try to predict the bottom (or top) of any market.

At the same time, the consensus seems to be that interest rates have nowhere to go but up, given the huge stimulus that the government’s been giving to prop up the economy.  One can argue whether and when the government should choke off the spigot of easy credit, but when it does, rates are going to have to go up.

Here’s the takeaway from the NY Times article:

“Instead of betting on home prices, you make a bet on whether money will become cheaper or more expensive, allowing you to buy more or less house.”

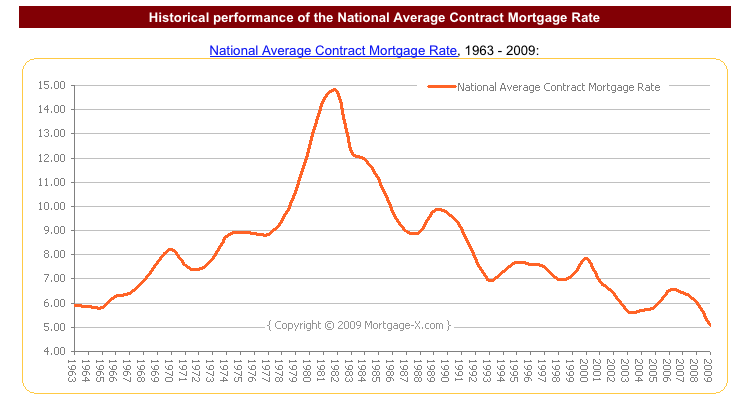
Now  it’s true that increasing interest rates ultimately lead to declining prices as tighter credit drives down demand.  That’s the theory anyway.  But after the huge declines we’ve already seen, it’s anybody’s guess as to when, where, or how that will happen.  As the article says, “don’t go there. Maintain your focus.”

Here’s a graph from mortgage-X.com on historical blended (ie. fixed, arms, etc.) mortgage rates.  Should make people who can qualify for a mortgage in this still-crazy market feel pretty good, no?

Did you like this? Share it:
Posted in Economy | Tagged , | 2 Comments

Noe Valley Still Goin’ Down?

Author: Jack French -- Used under Creative Commons Permission 2.0

Back in May 2009, I showed that Noe Valley was not immune from the slump in prices affecting the rest of the city, despite suggestions to the contrary from real estate agents, mavens and media.

Have things gotten any better?  Well, no.  And maybe.

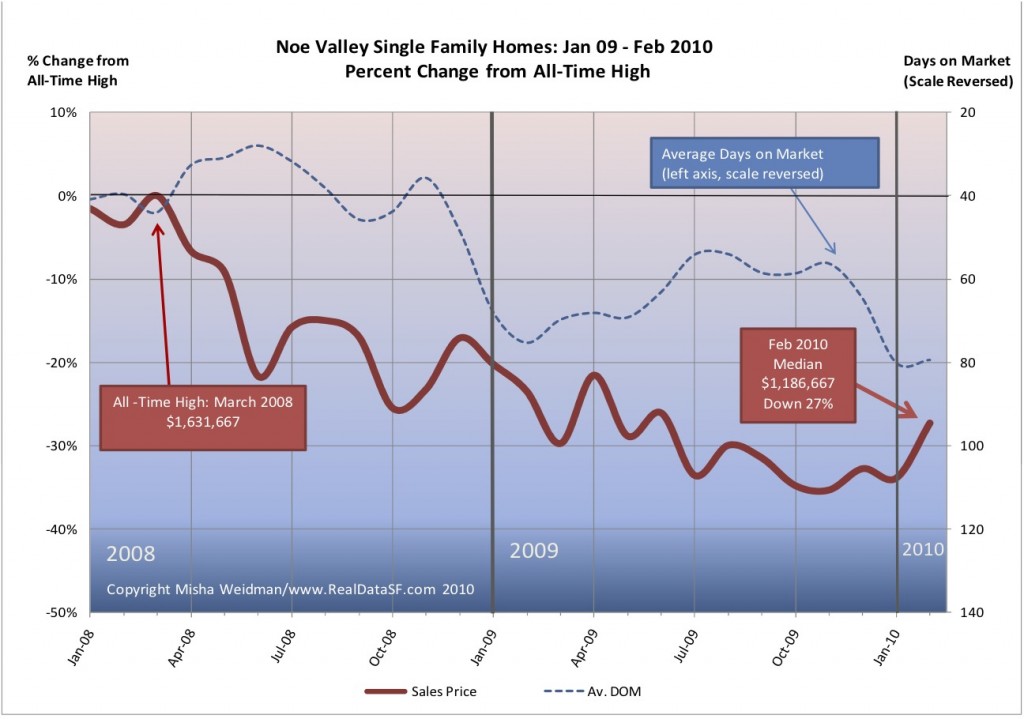
Here’s a chart showing percentage change in single family home prices for the last 14 months, relative to their all-time highs  (click to enlarge).  (All figures are 3 month moving averages.)

After reaching an all time high in March 2008, prices plummeted.  Just a year later, in the midst of fears of a global Depression, home prices were down 30%.  Did things get better?  No, they got substantially worse.  Despite an impressive  city-wide recovery in 2009, with prices going from 30% down to around 18% down for single family homes at  year’s end (see more detail here) , Noe Valley home prices continued to retreat.  In October and November 2009, prices were down 35%.  At year’s end, they’d barely clawed back two percentage points. Not surprisingly, days on market (DOM) remained stubbornly high for all of 2009.

Still, with cherry blossoms busting loose all over Noe Valley’s quiet streets, there certainly seems to be a change in the air.  There are many more listings coming onto the market and there’s even the occasional feeding frenzy over a clean, well-priced home.  These go in a matter of days, not weeks. Maybe that upturn in prices for January and February suggests a continued warming trend.

In the next few posts, I’ll look at Noe Valley in more detail, including how condos have fared.

Did you like this? Share it:
Posted in Market news, Noe Valley | Tagged , , , , , | 2 Comments

Looking Back at 2009: Condos/TICs

Pretty much everything I said about how single family homes fared in 2009 also applies to the condo/TIC market.   (TIC’s, aka Tenancy In Commons are similar to condos.  For more information on TICs, see my three-part series starting here.)

Condo/TICs hit their all-time highs about a year later than homes did — in July 2008.  But they’ve fallen from their highs almost exactly as much as homes have.  Condos/TICs were down 17%, just one percent better than single family homes.

For those who prefer their data on a per square foot basis, the picture is pretty much the same.  The all-time high was $711 — reached in November 2008 and the price per square foot stood at $592 at year’s end, also a drop of 17%.

While condos/TICs ended the year at the same point, the pattern has not been the same. Condos/TICs have been stuck near the bottom of their 2009 range after bouncing up in the first quarter. Homes, on the other hand, appear to have bounced up and stayed up.

What’s in store for 2010 remains anybody’s guess, but on the streets it certainly feels like spring is in the air.  There are more listings coming onto the market and more people looking at them.  Will that translate into sales and higher prices?  That’ll depend on macro-economic trends I’ve discussed elsewhere, but one thing’s pretty clear:  interest rates are heading higher, as evidenced by the Fed’s recent increase in the discount rate. If the economy continues to strengthen, that trend will continue.  And, for many people, that will result in less buying power and reduced affordability.

Did you like this? Share it:
Posted in Condominiums, Data, Market news, Tenancy In Common | Tagged , , , , | 1 Comment