At long last, here’s the promised data on Noe Valley condos and TIC’s.
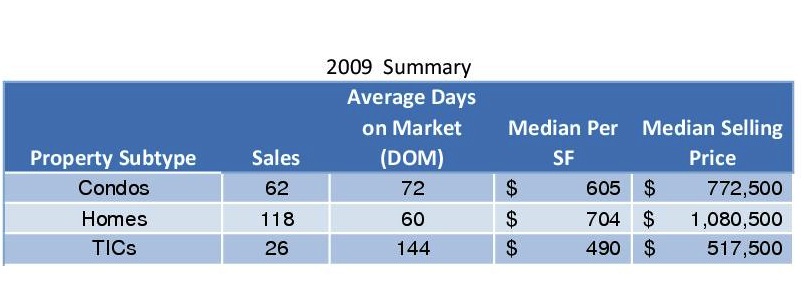
First, a look back (in anger?) at the make-up of Noe Valley sales in 2009.
Note that there were more than twice as many condos sold as TICs, and more homes sold than condos and TICs put together. (What’s a TIC? — Check out my series of posts on Tenancy-In-Common Interests, starting here.)
Also, that absurdly long DOM for TICs was distorted by 3 TICs at 201 Hoffman that took 410 days to sell. Still, without those sales, DOM for TICs (tired of the acronyms yet?) was still 99 days. And I’d be somewhat skeptical of the whopping difference in price between TICs and condos as well: TICs sales often don’t have a price per square foot listed, so there are very few data points — and there are very few sales to begin with.
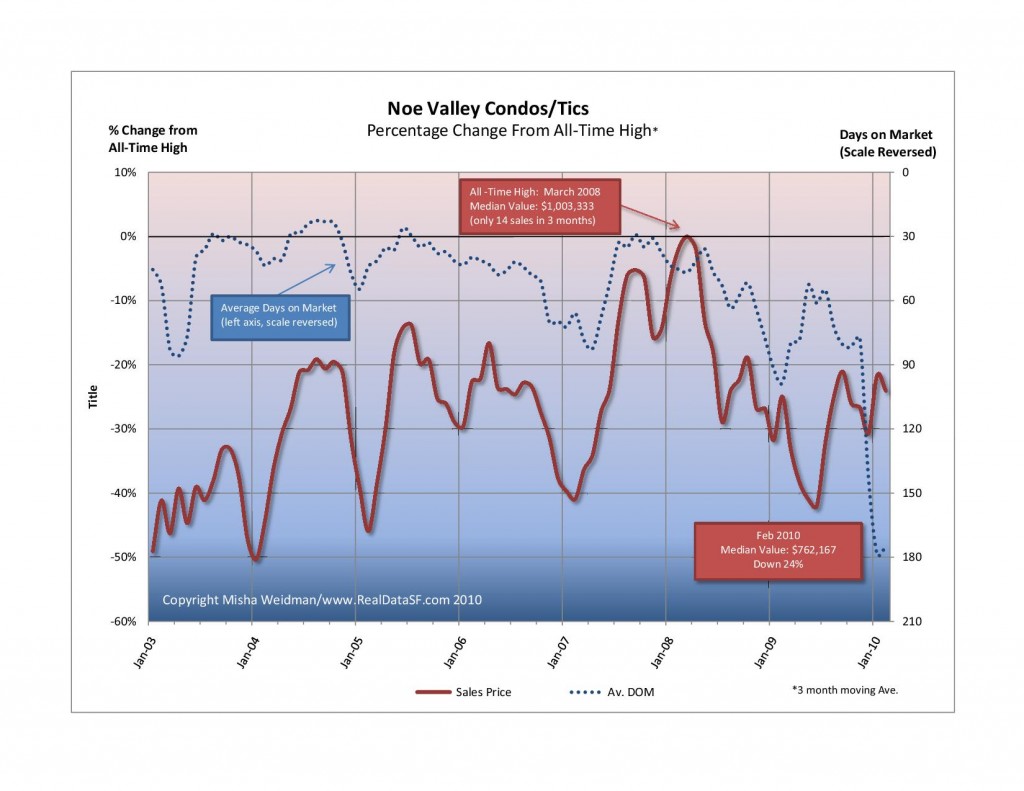
Here’s how condos and TICs have been doing as a combined group, versus their all-time highs.
That precipitous plunge (actually a huge increase since the scale is reversed) in DOM at the end of 2009 was also due to the lingering effects of 201 Hoffman.
For a shorter term view, prices through February 2010 are up 11% from January 2009 and are up a whopping 31% from the trough of June 2009. Since I use trailing 3 month averages, I think this is a belated reflection of the deep credit freeze of Spring 2009 when we thought the world might come to an end.
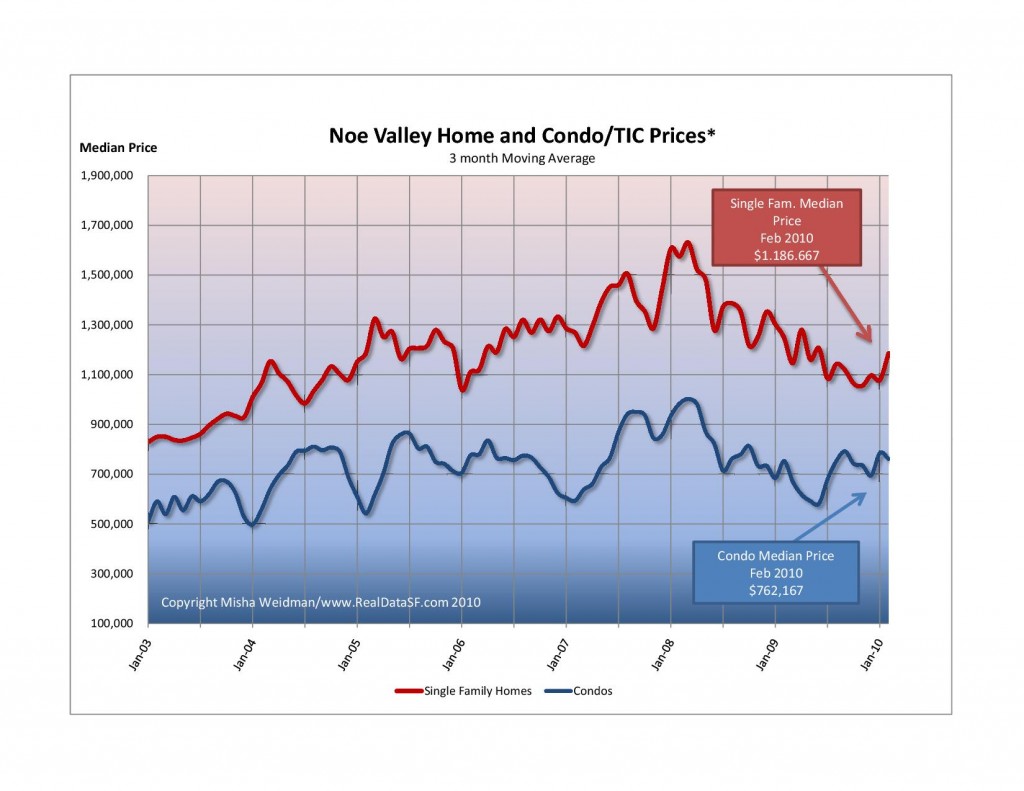
And here’s how condos and TICs stacked up against homes.
For what it’s worth, it feels like spring has really sprung. Nice-looking condos/tics are swarming with people and are moving fast — no kidding. Whether it will last is anybody’s guess.


