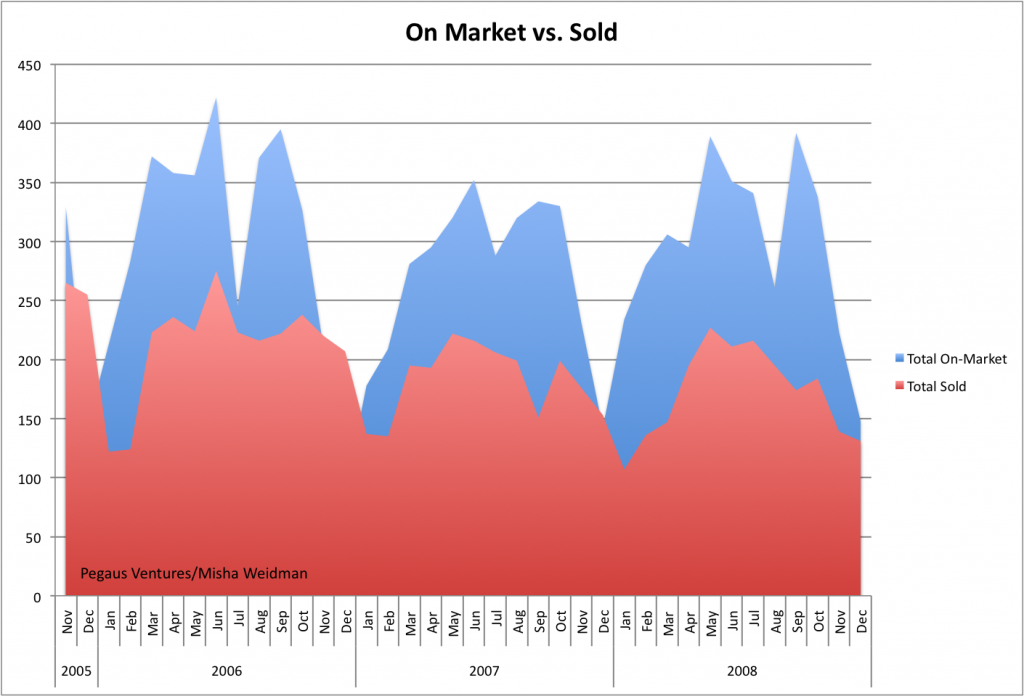
After talking to people about my last post on Absorption Rates and the lack of a correlation between slower absorption and lower median prices (or faster absorption and higher prices), I got the impression that there was some curiosity — skepticism? — about the underlying numbers. So I thought a post mortem of sorts was in order. Here’s a chart that simply tracks total listings and total sales over a little more than the two years covered by the Absorption Rate chart.

Total listings is defined as new listings plus anything that’s under contract but still “contingent” in the parlance of realtors. Total sales is exactly that. The chart reflects the raw monthly numbers with no averaging. This really highlights the seasonal fluctations: ie. the very evident drop-off in activity at the end/beginning of each year.
Other than the seasonal dips, maybe you can conclude that both listings and sales are trending downward, but I sure don’t see any evidence of a major change of direction in either.
A couple of closing thoughts. My absorption rate conclusions were based on an analysis of single family homes only. It’s possible that the conclusion would be different if I’d included condos and TIC’s as well. ie. Looking at the broader market might change the results.
On the other hand, it’s possible that correlations between absorption and price would appear if we looked at finer segments of the market. For example, we might find that absorption rates are longer at the high end of the market and that in fact prices have come down as we’d expect for that portion of the market.
Alas, the MLS database that’s the repository for sales information for brokers/realtors simply doesn’t allow you to do this sort of data-mining easily, so we’ll never know.
I stand by my previous conclusions: First, San Francisco just isn’t that overbuilt a market. Second, if you take out the seasonal fluctuations, the absorption rate doesn’t seem to have moved that much anyway. Finally, and perhaps most importantly, absorption rate doesn’t tell you how much activity (offers) each available listing is generating — in the end, just one property gets sold.
The question is whether there are other metrics that do a better job of tracking whether the market’s “hot.” Stay tuned.

And if you look at there is some lag between total on market and sold of course, given the drop, you can expect these sales to fall off the cliff.
Just as an FYI on NPR this morning the price of Millenium Tower ($1,000 a square foot, ridiculous you can now live in a commercial space for less than that given how many businesses are closing), went down 15% since they started to put the appts on the market.
Yeah, a couple of other bloggers have also noted that. But FYI, one would expect price per square foot on commercial always to be less than residential.